
By Matt A. Mayer
With the completion of the 2014-2015 state budget, it is clear that Governor John Kasich and the Ohio General Assembly prefer higher spending and tax cuts funded by projected higher revenues over making the tough choices to keep spending down. The sounder approach is to fund tax cuts with spending cuts.
This failure to make the tough choices today likely guarantees deficits in the near future. As the table below shows, the fiscal picture begins growing cloudy in 2015 and gets substantially worse in future years. This outlook makes very reasonable assumptions by tying spending increases to Governor Kasich’s three-year average (6.7%) and revenue increases to the average from 2001 to 2012 (2.46%), excluding the highest and lowest year of the national recession.
Keep in mind, these projections exclude the massive impact Medicaid expansion would have on the budget, especially in future years when federal funding recedes. With the continued uncertainty on how many Ohioans would enroll in an expanded Medicaid program—the range goes from Governor Kasich’s low of 275,000 to the Urban Institute’s mid-range of roughly 500,000 to the Kaiser Commission’s range of nearly 900,000—the budgetary implications likely would require severe cuts in other programs or tax increases.
Here are a few key highlights from the budget:
- From Governor Kasich’s first year to his fourth year, Ohio’s budget has grown by 20.1% or 6.7% each year;
- The budgetary growth under Governor Kasich is the largest increase during a gubernatorial term since 1991;
- Unless spending slows and/or revenues exceed the average growth since 2001, Ohio will begin running deficits in 2015;
- If the next two budgets grow at the same rate as the last two budgets, Ohio’s budget will surpass $41 billion in FY2019; and
- If revenues grow at the same rate (excluding the high and low years), Ohio’s revenues will hit $34.5 billion in FY2019, resulting in a $6.6 billion one-year deficit and $11.4 billion two-year deficit.
The U.S. has had five recessions from 1975 to today, with one occurring roughly every ten years. Four years have passed since the last recession ended. As with Medicaid expansion, a cyclical recession would make these projections even worse.
We have to make tough choices everyday. Why can’t our politicians?
Ohio Revenues and Expenditures 1975-2019*
(in billions & color-coded by political control)
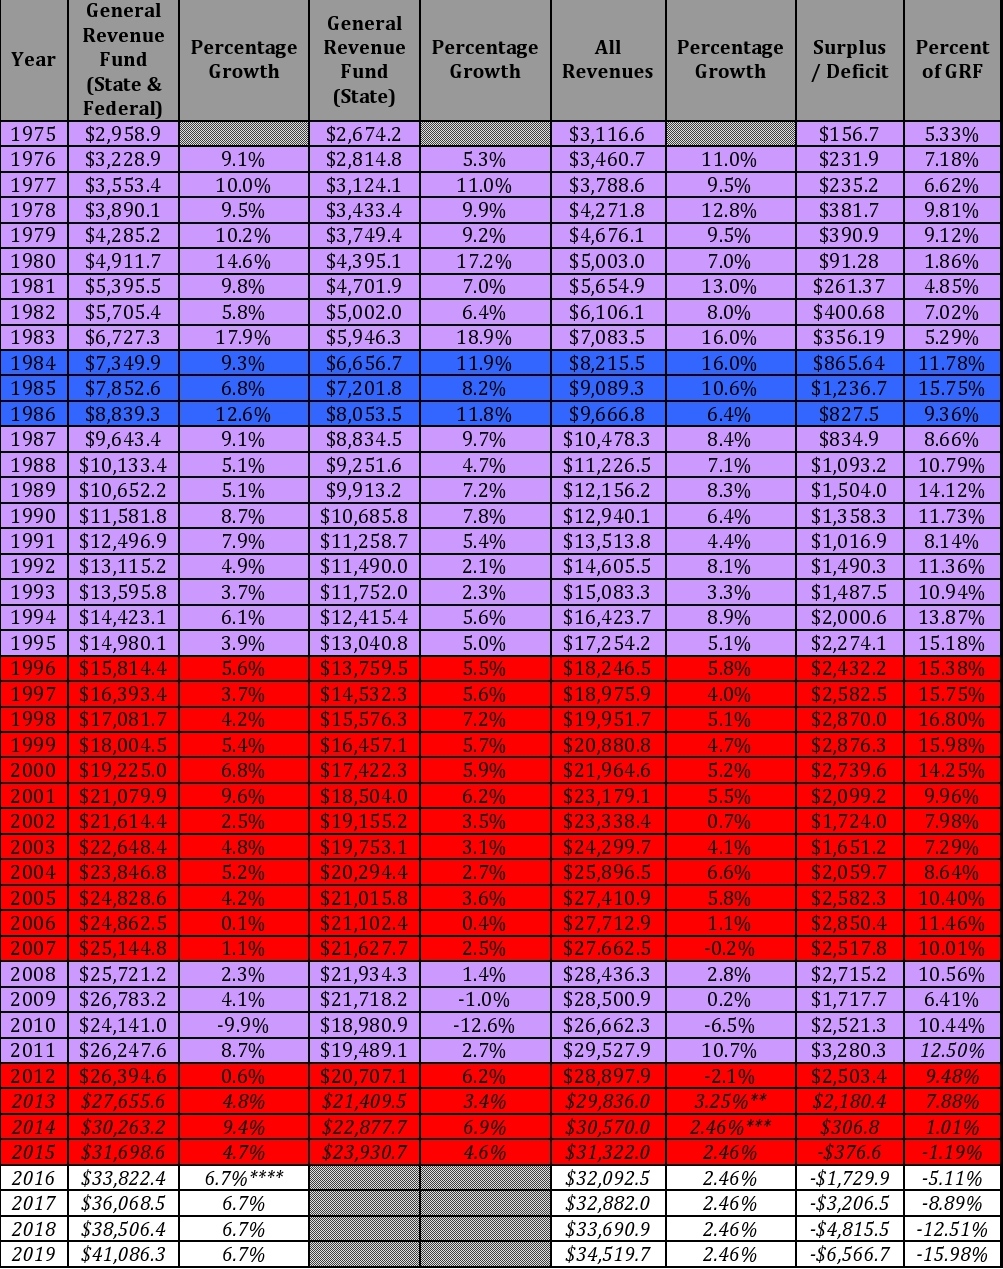
*All data comes from the Ohio Legislative Service Commission at http://www.lsc.state.oh.us/fiscal/revenuehistory/staterevenue.htm.
**Projection based on the April 2013 to May 2013 trend.
***Average rate of growth from 2001-2012 excluding highest and lowest years.
****Average rate